Meixner curve (hyperbolic secant distribution)
In probability theory and statistics, the hyperbolic secant distribution is a continuous probability distribution whose probability density function and characteristic function are proportional to the hyperbolic secant function. The hyperbolic secant function is equivalent to the reciprocal hyperbolic cosine, and thus this distribution is also called the inverse-cosh distribution.
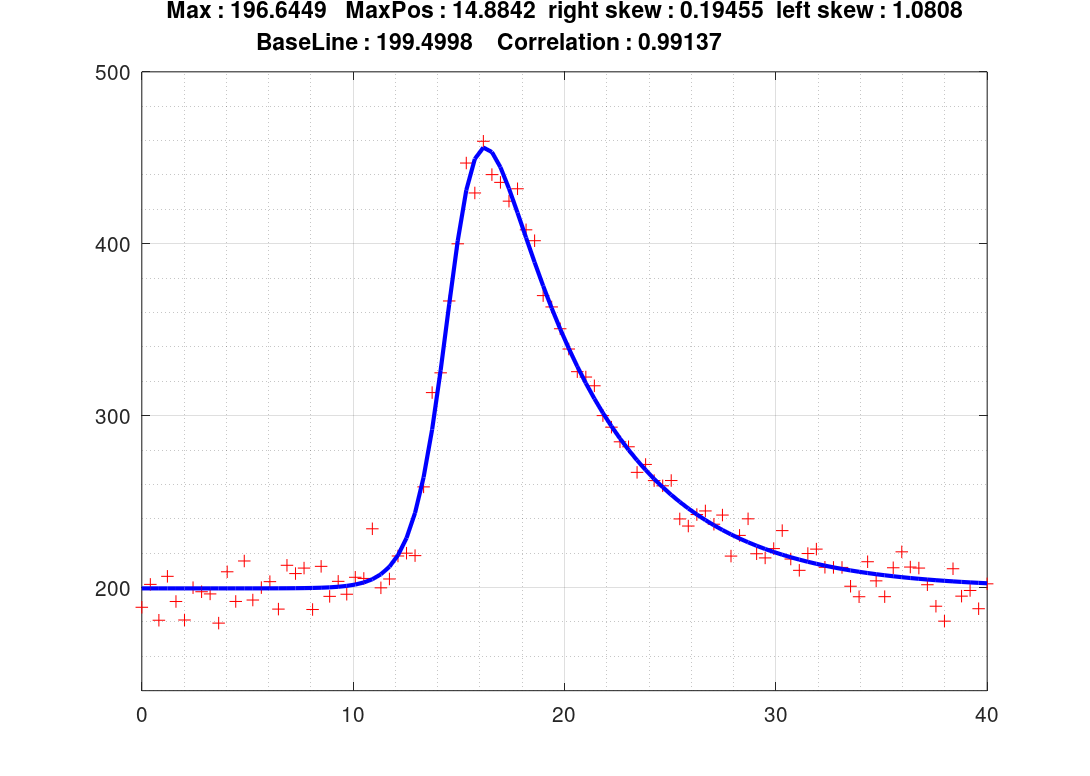
Generalisation of the distribution gives rise to the Meixner distribution, also known as the Natural Exponential Family - Generalised Hyperbolic Secant or NEF-GHS distribution.
![]()
y = 2.*p(1)./(exp(p(2).*(x10-p(4))) + exp(-p(3).*(x10-p(4)))) + p(5);
SCRIPT : (www.octave.org)
clc;clear all;
global x10 y10
function delta = effe(p); % MINIMIZING FUNCTION
global x10 y10
y = meixner(x10,p);
delta = sumsq(y - y10);
endfunction
function y = meixner(x10,p); % INTERPOLATING FUNCTION
y = 2.*p(1)./(exp(p(2).*(x10-p(4))) + exp(-p(3).*(x10-p(4)))) + p(5);
endfunction
% Start Guess is defined (4 parameters)
p0(1) = 195; %200 Maximum intensity
p0(2) = 0.6; %0.2 right skewness
p0(3) = 1.5; %1 left skewness
p0(4) = 18; %15; Max position
p0(5) = 200; %200; baseline
% Some noisy data are generated
x10 = linspace (0,40,100)';
y10 = meixner(x10,[200 0.2 1 15 200]) + 10*randn(100,1);
% fMinSearch on the sum of squares of delta
fer = @(p) effe(p);
[p1,fer1] = fminsearch(fer,p0);
% final plot
figure (1,'position',[200 100 700 500]);
plot(x10,y10,'r','marker','+','linestyle','none'); % points
axis([0,40,140,500]);grid on;grid minor on;hold on;
y11 = meixner(x10,p1);
plot(x10,y11,'b','linewidth',2); % curve
title(["Max : ",num2str(p1(1))," MaxPos : ",num2str(p1(4))," right skew : ",num2str(p1(2)),...
" left skew : ",num2str(p1(3));" BaseLine : ",num2str(p1(5))," Correlation : ",num2str(corr(y10,y11)) ]);